As the web editor for The Daily Item newspaper in suburban Boston, I developed database reporting skills and multimedia tools to bring that data to life in interactive maps, graphs and charts. I’ve created multimedia for everything from violent crimes in a city, to sex offender regulations, to campaign finances for the Massachusetts 6th District Congressional race. Below are some examples of my work.
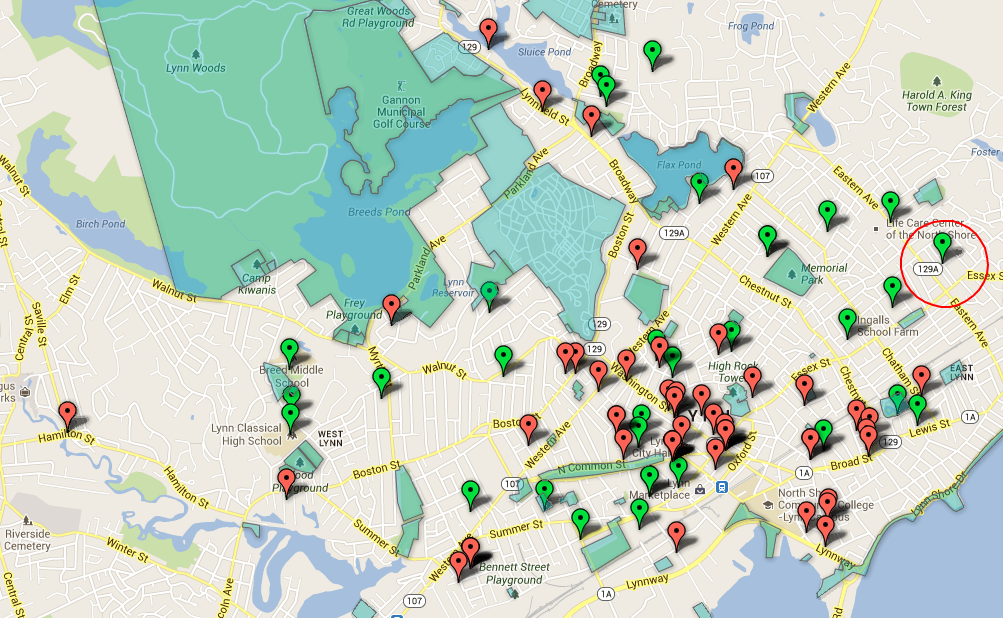 Violent crime in Lynn during a three-month period in 2011. I mined the data from police call logs using Access and created the interactive map using Google Fusion tables. Click on each point for more information.
An interactive map of where level-3 sex offenders live in Lynn in comparison to city parks and schools they are prohibited from living within 1,000 feet of. (Readers can drag a 1,000-square-foot radius circle around their neighborhood to compare.) I used police and city property records to create this map.
Local bus routes affected by Massachusetts Bay Transit Authority budget cuts. Click on each route for more information.
Salaries of municipal employees in 8 different towns on the North Shore of Boston. Click on each story and scroll to the bottom to view the salary tables, which were created, formatted and embedded by me.
I am also familiar with researching campaign finance records to report on Congressional races, including the contentious 6th District Congressional race in Massachusetts in 2012.
